Background
The analytics environment of CM.com's marketing software had very low adoption and was difficult for users to set up. Moreover, the backend technology was outdated and was not able to perform with the growing user base. Competitor analyses showed that usable analytics was major a lacking feature, and user interviews yielded an opportunity to increase adoption of the software when improving this. This created an opportunity to redesign the user journeys and interface.
Role
UX Designer @  CM.com
Team
Product Manager, Engineering Lead, Customer Success Manager
Tools & Skills


I initiated and led the project from start to finish, from generating user insights to evaluating the implementation of the design. I took the opportunity to push for a user-centric approach to building a new analytics environment, rather than a technological approach as was done with the initial version. The project ran for 4 months.

Click here to get an impression of the CDP dashboard at the start of the project.

The process
I interviewed 10 customers about what tools they use for analytics, and what could make their data more useful and actionable. From this, I formulated insights into the user experience of the current analytics dashboard, ideas for new metrics that were considered useful for CDP users, and insights in how people would like to use these metrics. These were all collected in a set of 40 user requirements.
The user requirements were evaluated with the feature team on feasibility and effort. In collaboration with the engineers, I designed a mockup screen of potential analytics dashboards, while collecting and categorising the different visualisation needs (chart types, tables, etc.).
Next, I designed a new analytics environment for CM.com’s own marketing managers. I designed mockups using the data they stored in their own account, and evaluated these with the marketing department. Kinks were ironed out in a second design iteration. The result was evaluated in interviews with same 10 participants questioned before. High-fidelity prototypes were made using the customers’ actual data.
Result
A fully revised approach to the analytics dashboards that is easy to get started with (through templating) and highly customisable for expert users. 2 Months after deployment we saw a steep increase in adoption of the analytics dashboards. Later, the dashboard components were embedded across multiple applications within the Mobile Marketing Cloud suite.
40
user requirements prioritised and implemented in new designs
4
Pre-defined, easy-to-understand analytics dashboards
+66.5%
Increase in adoption of the analytics environment
Insights
Never start with a blank page
Originally, users could build their own dashboard and create their own metrics using almost all data in their CDP. This principle is great for advanced users, but very tricky for new users.
That’s why I introduced templated dashboards: Everyone starts out with pre-filled dashboards with the most relevant metrics for their situation (depending on the features enabled for their account). Users could then show and hide individual metrics to customise their dashboard. This helped new users to ease in to the complexity of data analytics, it increased discovery and adoption instantly.

Filtering to allow for deeper digging

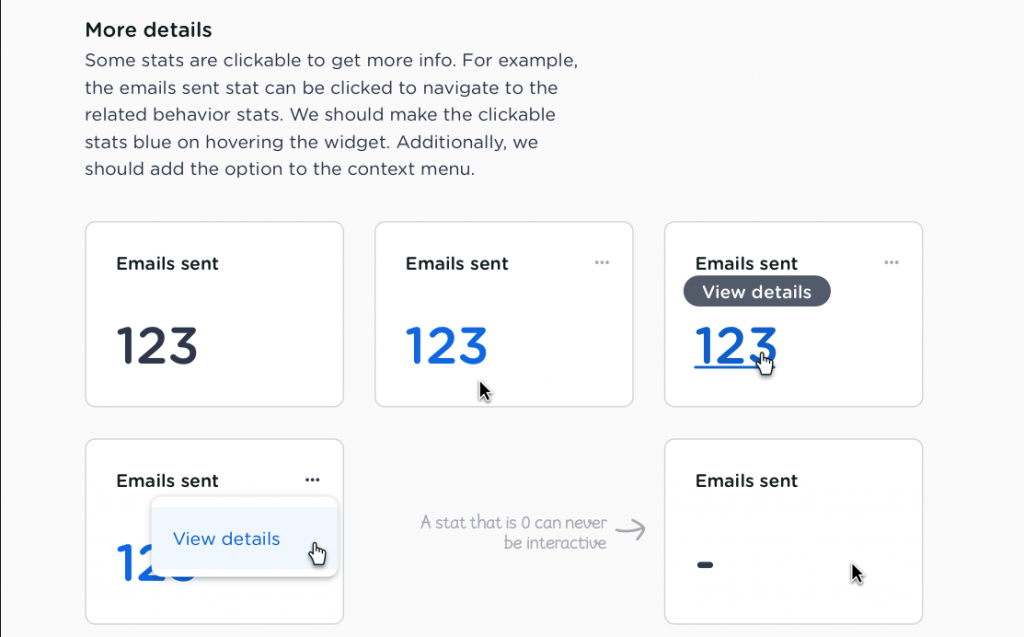
Make everything actionable
All metrics shown in the dashboards are made actionable. This means that the user could click a card to see all profiles associated with the metric.
Bring clarity about the data’s age
Technical limitations demanded that not all metrics could be calculated real-time. With caching, this meant that some data might be out of date. This made it incredibly important to show how long ago the data was last updated, and to give the user a way to force an update on the data

Collect continuous feedback to keep improving
The introduction of the new dashboard created an opportunity for continuous feedback collection from our users. A small form at the bottom of each dashboard allowed visitors to ask for more metrics and additional features.
The collected feedback was evaluated monthly with the team’s Product Manager, Engineers, and Implementation consultants to find new opportunities to improve the analytics for our CDP. In 3 months time, we collected more than 40 suggestions for improvements.
